
Techniques for Displaying Project Schedules
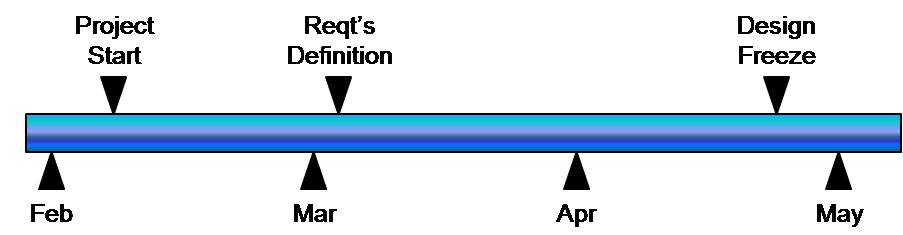
Milestone Chart
Task List

Gantt Chart (Bar Chart)

Network Diagram

Kanban Schedule

Calendar View
The project calendar view provides a perspective on the current activities for the day or week. Each of the activities that should be underway on any given day are listed in that day on a calendar of the week/month/year. This view provides an excellent perspective of what tasks need to be staffed on each day. This leads to a focus on assigning resources. The primary purpose for this view is to aid in the daily staffing and resource assignments. It is most commonly used when the resources are assigned every day from a resource pool, such as test technicians or manufacturing operators.
Techniques for Analyzing Project Schedules
Critical Path

Critical Chain
The Critical Chain technique was developed by Eliyahu Goldratt. This technique builds on the analysis done using critical path and resource leveling techniques. It is used when the resource leveling technique has delayed the end date of the project. Critical chain reprioritizes the work, applying principles of the Theory of Constraints, and provides simple tracking principles to accelerate the project and ease the burden on project management. This is done by determining the best allocation of the critical or constraining resource and shifting the tracking approach to concentrate on this resource. The critical chain approach requires the development of the network diagram and the critical path and resource leveling calculation to have been done. Once this is accomplished, the constraining resource or most constrained if there are multiple constraining resources is determined and a sequence of project tasks that the constraining resource MUST contribute to is determined. The estimates for those tasks are reviewed and any work that can be shifted to an unconstrained resource is reallocated. This sequence of tasks, known as the critical chain, is then scheduled based upon the availability of the constained resource. All other tasks are then scheduled to occur in parallel with the critical chain. These parallel paths are scheduled so as to ensure there is float, or a buffer, at the end of the path, prior to a handoff into the critical chain. This buffer float is then tracked by project management to ensure that these tasks and sequences complete prior to the need for their results by a critical chain task.
PERT
PERT, which stands for Program Evaluation and Review Technique, was developed by the US Navy in the 1960s as a way to put boundaries around overall project durations. At that time the Navy was doing development that was on the leading edge of technology and the estimates for task durations were often very uncertain. Individuals or organizations that were risk adverse would typically set a conservative schedule, while individuals or organizations that were risk seekers would often set an aggressive schedule. The final result would usually be between the two estimates. The Navy established the analysis tool of PERT to determine the best case and worst case boundaries for the project. In addition, they created a PERT estimate for each task and using the task-level PERT estimate they would create a project PERT schedule duration. The PERT estimate is a simple risk-mitigation approach that considers the best case and worst case of a task estimate but also includes a most likely estimate that is between the two and is heavily weighted. The three estimates are averaged using the PERT formula to create the PERT estimate for the task. A PERT analysis starts with a network diagram. Each task duration is estimated three times, the best case, worst case, and most likely case. A worst case schedule is developed using only worst case estimates. A best case schedule is developed using only best case estimates. A PERT estimate is determined for each task. A PERT project schedule is then set using the PERT estimates. This is often considered a poor man's simulation for estimating.
Resource Leveling
Resource Leveling is a technique used to smooth out the peaks and valleys in the required project resources. This leveling process usually results in changes to the project schedule. Through the use of leveling, the best allocation of resources assigned to the project can be determined. The resource leveling technique applies when the project has been planned with a high degree of parallelism. Usually in this case many of the different parallel paths will have float (unless they are a critical path). That float is used to reposition tasks so that the resources required to conduct that task are not needed at the same time on another task. To do resource leveling, first the network diagram is developed and the task durations and resources requirements for each task are determined. Next the critical path is calculated. Resources are then assigned to critical path tasks first. Once all critical path tasks have been fully resourced, then the resources are assigned to the other tasks using float to reposition tasks between their earliest start and latest finish time and at a time when resources are unallocated. If, after using float to reposition tasks, there is still an insufficient amount of resources at some time in the project, then tasks are stretched or delayed past their latest finish time until the resources are available. This will extend the end date of the project. This analysis is typically done using project management software. However, a caution when using software some applications do not fully protect the critical path but are quick to start stretching and delaying tasks.
Schedule Acceleration
Schedule acceleration techniques are used to shorten the overall length of the project. However, they are not free. While they reduce the planned total duration of the project, they do so by increasing risk in some other aspect of the project. They need to be deployed carefully, and always with an update to the project risk management plan. There are five schedule acceleration techniques - each with its own unique set of risks. Selecting the technique, or combination of techniques, to be used depends on the characteristics of the activities to be accelerated and the overall risk sensitivity in the project.
Buffer Management - Buffer management reduces the buffer that is inherent in the estimates of uncertain activities. When estimating uncertain activities, project managers tend to allow for the uncertainty by using a conservative estimate. (This is not the same as "padding" an estimate which just arbitrarily adds time or money to an estimate - rather this is a conscious decision to prepare for the unknowns associated with the uncertain activity.) Buffer management removes the buffer from the activity estimate, thereby creating an aggressive activity estimate. The setting of aggressive activity goals will often result in a reduced activity duration. However, the risk is that now there is a much higher probability that the activity will finish late as compared to the plan. When this technique is used, the project manager needs to maintain a project-level schedule reserve to compensate for the activities that will be late.
Crashing - Crashing accelerates an activity by adding additional resources. Some activity durations are limited by resource availability - more resources would allow a faster completion. While this is not true for all activities, it is true for some. (A 72-hour burn-in test on a printed circuit card module cannot be accelerated by adding additional test technicians - it still takes 72 hours. However a dedicated courier can deliver a report overnight that would normally take three days to deliver by mail.) This will often increase the overall cost of the project as the additional resources are often added at a premium.
Fast-tracking - Fast-tracking accelerates the project by starting activities prior to the completion of all the predecessor activities. This can only be done when there is a preliminary result of the predecessor activities. For instance, a preliminary Bill of Materials may be developed during a design process and raw materials for production may be ordered based upon the preliminary Bill. (This is often done when ordering Long Lead Material.) If the Bill of Material does not change during the final design review and baselining process, the project is accelerated. However, if the final Bill of Material does change, the material ordered from the preliminary Bill may need to be reworked or scrapped - increasing the effort and cost to the project. This technique is viable when the predecessor activity has a preliminary deliverable that the project management team believes is stable.
Split-to-Phases - The Split-to-Phases technique is used when the project has multiple, separable objectives. The scope of the project is divided into phases based upon the activities that are unique to a project objective. This allows a focusing of project resources on the activities supporting one of the objectives at the expense of the activities supporting a different objective. This will result in an early completion of a portion of the project, but usually causes a delay in another portion of the project and often an increase in cost because of activities that must be repeated for each of the phases. (For instance there may be a User Acceptance Test that would now need to be done twice instead of just once.) This acceleration technique is appropriate only when the completion of the first phase is able to immediately start producing some business benefit, without the completion of the succeeding phases.
Mainline-Offline Scheduling - the Mainline-Offline technique separates the work within an activity into two components. The first is that which can be done generically without specific knowledge of the results of predecessor activities. The second is that which can only be done once the predecessor activities are complete. An example would be creating a project requirements document. A generic template can be created based upon the general understanding of the project. The specific requirements are identified based upon meetings with stakeholders or analysis of business processes. (One of the business benefits of a Project Management Office is that it develops and maintains these templates and generic activities, allowing projects to be accelerated through the use of them.) This technique only works with some activities, and requires the foresight to anticipate the need for the generic portion of the activity to be accomplished prior to the completion of the predecessor activities. Once an activity has started, there is no advantage to do the activity first in a generic manner and then in the project specific method.
These methods can be used in a stand-alone manner or in combinations. However, they all result in some level of increased risk to the project. Whenever a schedule acceleration technique is used, the risk analysis must be updated to include the risk associated with the technique failing to deliver the potential benefit.