Friday, December 29, 2017

Project Risk Management Tools & Techniques

Project Risk Management is the process or activities associated with identifying risks, analyzing risks, developing appropriate responses to risks, and monitoring risk triggers. Risk management is a primary role of the project manager. While other project team members will be involved in all of the Project Risk Management processes. It is the responsibility of the project manager to ensure that risk management is done and that risk triggers are being monitored.

The PMBOK has defined Risk as, "an uncertain event or condition that, if it occurs, has an effect on at least one project objective." The objectives are identified during project initiation and include the major elements of scope or deliverables, key milestones, budget constraints, or any other aspect of the project identified as a key success criteria by the stakeholders.

Risks can be positive or negative. Typically we focus on negative risks, and these are the ones that are likely to result in project failure. However, there are positive risks which are opportunities for the project team to perform better than required on at least one of the major objectives. In my experience, positive risks, referred to as opportunities, must be identified early in the planning processes to take advantage of them in the project. Otherwise the cost and schedule impact of changing the plan will typically outweigh the benefit. Negative risks, referred to as threats, can be avoided if addressed early. However, these must be monitored and tracked throughout the life of the project.

The process of project risk management typically is viewed as a five step process. The first step is Risk Identification. Next is Qualitative Analysis and, when necessary, Quantitative Analysis. Once analyzed, Risk Responses must be developed for those risks that require them. Finally, Risk Monitoring must be done for those risks that require ongoing monitoring. I prefer to manage this process using a Risk Register.


Risk Register


The Risk Register is a spreadsheet that tracks the management of risks, both threats and opportunities, through the project lifecycle. The register not only aids the project manager in the process of risk management, it creates a document for archiving with the project files that can be used for Lessons Learned and a historical record.

The Risk Register is structured so that each row is a risk and the columns track information associated with the various risk management processes. The precise columns you use are a matter of personal preference. I like to have columns that identify the risk and where in the project the risk will have an impact. I then have columns indicating the results of qualitative analysis and quantitative analysis. I also have columns showing the selected risk responses and the status of any mitigating actions or the risk triggers that are being monitored.


Risk Identification


In order to do effective risk management, you must start with risk identification. That sounds really "Duh," but I have set in many project reviews and asked questions about the risk identification process only to find that it was never done. Instead someone copied the risk list from a previous project and started working with it, even though many of the items did not apply to their project.

There are many ways to identify risks and if your organization has a standard approach that works, use it. When there is no standard approach, my preferred method is to use a variation on the Fishbone or Ishikawa diagram. I start with a major project impact such as, "major schedule delay" or "test failure." I then try to identify all the possible reasons why that might happen on this project and document those in the bones of the Fishbone. I normally will do several of these diagrams, one for each major project impact. I will do these for both project threats and project opportunities. For instance, I might have one for, "Early completion" or "Major Under-run." All of the items that are listed then are transferred to the Risk Register for further analysis.


Qualitative Risk Analysis


Once the list of potential risks has been developed, the next step is to analyze them. This can look to be a daunting task if there are many risks. Therefore, the first step in the analysis is to filter the risks to determine which are the significant risks and which are insignificant. There are many techniques for this and they are known as qualitative risk analysis. I will discuss three of my favorite, the red-light/green-light rating, the risk matrix, and the urgency assessment.

The red-light/green-light rating is a subjective assessment of whether the risk will likely have a major impact on the project. The risks are divided into three groups, one is "red" risks, one is "yellow" risks, and the last is "green" risks. The thresholds for these categories can be based upon the cost impact, the time impact, the quality impact, the probability of occurrence, or a combination of these. I normally view the "red" risks as those that are likely to occur and will significantly impact one of the project objectives. These risks must be addressed; usually with an immediate change to the project plan. The "yellow" risks are those that may have a major impact on the project, but that I believe we can manage through with the current plan. However, they are serious enough that they are watched closely. The "green" risks are those that either are insignificant or they are risks that were once "red" or "yellow" and have now been mitigated.


The next approach for qualitative risk analysis that I use is the risk matrix. This matrix can be setup as a 2x2, a 3x3, a 4x4, or a 5x5. What size you use is based upon personal preference. The vertical side of the matrix is labeled probability and the horizontal side is project impact. The scale on the matrix goes from low to high on each side. How low or high are defined should be based upon the major objectives of the project. Once the matrix is created, I place each identified risk on a post-it note and then locate the risk in the appropriate spot on the matrix based upon the likelihood of that risk happening on this project and the impact to the project objectives if it did occur. The risks in the upper right corner are major risks that must be addressed in project planning. The risks in the lower left cornere are minor risks and can be ignored.

The third approach for qualitative analysis I use is an urgency assessment. In this analysis I consider when in the project the risk must be managed. Some risks do not have the potential to occur until late in the project, others would occur early, and still others could occur at any time. The urgency assessment identifies anything that is an immediate issue for the project management team and which risk issues are not yet in play.

Quantitative Risk Analysis


Quantitative risk analysis are techniques that attempt to quantify the project impact of the risks. These techniques are generally much more complex than the qualitative techniques and therefore require much more time and effort to complete. I find that if I do the qualitative techniques first, I then can focus my quantitative techniques on just the few high risk items. These are the items that are most likely to require a significant amount of project management effort and possibly discussion with stakeholders to address threats to boundary conditions. Prior to the stakeholder meeting, I like to have a quantitative analysis done so that when I meet with stakeholders we can focus our discussion around the business impact of doing nothing as compared to doing something. The following is the list of quantitative techniques I recommend.

Sensitivity Analysis - in this technique the project plan is developed without the risk factor occurring and then the risk factor is introduced and the plan is redone with the risk impact in place. This provides a demonstration to the stakeholders of why the risk is important and needs to be addressed.

Failure Mode Effects Analysis (FMEA) - this technique is excellent for addressing technical or quality risks. It is not very effective for addressing cost or schedule risks. However, since the risk is quantified based upon safety and security issues, it can be very useful for explaining why a change in project requirements is needed.

Decision Tree with Expected Monetary Value - this technique can require a significant amount of time to set up, but once established it can easily be reused as project assumptions start changing and the project is forced to react to the changing circumstances. The decision tree shows the impact of decisions and risk events on project activities and the expected monetary value quantifies those impacts.

All of these techniques require hours and possibly days to complete. There are other quantitative riak techniques, however, I find that they are even more time-consuming and expensive. The results of the other techniques are typically no better than the ones listed above.


Risk Response Techniques


Based upon the analysis, some risks will require a response in the project plan, some will only require a response in the project monitoring, and some will not require any response at all. If a risk is deemed to be high, it needs a response. Responses to negative risks - threats, are one or a combination of these six responses:

Avoid - the project plan is changed so that it is impossible for the risk to occur because the project is never susceptible to that type of risk. Some risks cannot be avoided.

Mitigate - the project plan is changed so that when or if the risk occurs it will only have minor effect because the threat has been anticipated and provisions for addressing it are in place.

Transfer - the project plan is changed so that an outside agency assumes responsibility for addressing a portion of the risk impact.

Escalate - the project plan needs to be changed beyond the boundaries set in the Project Charter.  This requires stakeholder approval.

Accept - the project plan is not changed because the risk is so insignificant or the risk is so improbable that no change is needed.

Contingency Plan - the project plan is not significantly changed, although a risk trigger is established that can be used to indicate whether the risk will occur and if so in what fashion will it impact the project. If possible a "Plan B" is developed, or at least has been considered. If the trigger occurs, the "Plan B" is put into effect and the project is changed at that time.

There are also six possible responses for positive risks - opportunities. In almost every case, these opportunities must be identified early in the project if there is to be any hope of realizing the positive benefits they entail. The six responses to opportunities are:

Exploit - the project plan is changed from the normal approach for this type of project to take advantage of the unusual condition that is occurring.

Enhance - the project plan is changed so as to create an opportunity for improvement in the ability of the project to achieve one of its objectives.

Share - the project plan is changed so as to bring an outside partner onto the project that creates opportunities to improve one of the project objectives.

Accept - the project plan is not changed because the opportunity is so small or so unlikely that the risk of change creates a negative risk outweighing the opportunity.

Escalate - the project plan needs to be changed beyond the boundaries set in the Project Charter.  This requires stakeholder approval.

Contingency Plan - the project plan is not significantly changed, although a trigger is established that will provide notice that an opportunity is now available to improve on one or more of the project objectives.

It is important to note that in the absence of choosing to do something different, the "Accept" option will apply to any threat or opportunity. If "Acceptance" is not appropriate for the risk, action must be taken to either change the plan or to begin monitoring the risk trigger.

Risk Monitoring and Control


Risk monitoring is much of what a project manager does once a project moves beyond the planning stage. As project activities are being accomplished, the project manager should be tracking the risk triggers to see if any project changes are needed. The risk triggers should be listed on the team-level project dashboard. In addition, I revisit the risk register whenever a project goes through a replanning and at major Management Reviews to determine which risks have been eliminated and to add new risks to the register.

I also use the risk register to document the result of risk monitoring activities. The risk register tracks the status of project changes or mitigations that have bee initiated to address risk issues. The risk register also captures the impact of mitigating actions for those risks that are mitigated.

Project Management Estimating Tools & Techniques

Estimating the effort, time, and resources needed to complete project activities is one of the most challenging tasks that project managers must face. This is because of the inherent uncertainty associated with many activities.

Projects are unique. That is one of the differences between projects and processes. This uniqueness often creates uncertainty. Uncertainty because the activity is unique to the project, or the activity is being accomplished by a resource that is not a practiced expert, or the interaction of this activity with other project activities is unique in this project. All of these can create problems when estimating effort, time or resources.

Uncertainty in one aspect of an estimate leads to uncertainty on the other aspects. If the effort needed to complete the scope is uncertain - for instance the number of hours of work needed to complete an analysis - the time and resources needed will be uncertain. If the timing of when an activity starts or ends is uncertain, the resource availability and amount of effort required may change. If the resource assigned to an activity is uncertain, the number of hours required to complete the activity and the timing of the availability of the resource will be uncertain.

However, the good news is that not all project activities are uncertain. In many cases, the activity is one that is well defined and the organization routinely accomplishes it. When possible a project team is formed so that an expert is doing the work and the availability of the expert is predictable. In those cases an accurate estimate can be quickly generated.

I'll discuss three types of activities and what type of estimating approach should be used with each of them. Those are the Stable Activities, the Dependent Activities, and the Uncertain Activities. Of course there is a fourth category which is the unknown activity. These can't be estimated but must be accounted for in the project reserves. A Traditional or Discovery project often will have a small reserve (or possibly none at all) - at least for that portion of the project that is approved. Whereas an Adaptive or Extreme project may need a large reserve. Also, as complexity increases typically the level of reserve increases since there is a greater possibility of unrecognized activities. After discussing the three types of activities, I will explain some of the more common techniques for estimating project activities and their strengths and weaknesses. The techniques will include Analogous, Parametric Modeling, 3 Point Estimate, Expert Judgment, Published Data Estimates, Vendor Bid Analysis, Reserve Analysis, Bottom Up Analysis, and Simulation. A discussion of estimating the cost of completing a project that is underway is addressed in the page on Earned Value Analysis. Finally, I will discuss how to estimate a project when the key boundary condition is the End Date or the Total Cost of the project and the effort is tailored to fit this constraint.

Stable Activities


Stable Activities are those that are well understood and predictable. For activities in this category, the estimating is usually straightforward. I will typically use analogous, expert judgment, a parametric model, or published estimating data for these types of activities. Based upon the information available to the project team members, use the appropriate technique and set the estimate.

Dependent Activities


Dependent Activities are thole activities where the time or effort is highly dependent upon some project attribute or characteristic that is not yet know or knowable at the time the original estimate is furnished. For instance, the amount of time needed to complete testing will depend upon whether the test is successful on the first try or whether a retest is required. For these types of activities, an assumption is made that will drive the estimated effort, time and resources. This assumption is a risk and should be tracked on the Risk Register. If the assumption is incorrect, the time or money required to do the activity may be very different from the estimate. If a conservative estimate is used, this is a positive risk. If an agressive estimate is used, this is a negative risk.

For these Dependent Activities, I often use the 3 Point Estimate, Expert Judgment, or Analogous Estimate. Also, if a project activity is outsourced and it is a Dependent Activity, I will consider what assumptions are used by the supplier and do a Vendor Bid Analysis. If there are a large number of Dependent Activities in the project, I will factor that into the project Reserve Analysis.


Uncertain Activities


Uncertain Activities are the most difficult to estimate. There is often very little data to support a precise estimate. In addition, there are many factors that could effect the estimate so I can't just make one assumption and track that in my risk register. An example of an Uncertain Activity is a requirements definition task on a Complex project. There are numerous stakeholders who have different opinions of what is needed. Getting all of them to agree on the requirements will be an iterative process with the number of iterations being completely unpredictable. Yet if this task is not done well, there are likely to be major problems later in the project getting the stakeholders to agree that the project deliverables have been met. Uncertain Activities typically are listed in the Risk Register since the timing and cost are impossible to estimate accurately.

For these Uncertain Activities, I often rely on the 3 Point Estimate to set the activity boundaries, although Published Data or Parametric Models can also be used to do this. Then I use Analogous or Expert Judgment to set the actual estimate. These activities must be considered in the Reserve Analysis. Often the estimate on these activities can be improved by decomposing the work of the activity and conducting a Bottom Up Analysis on that work. This will isolate the uncertain portions of the activity and allows for accurate estimates where possible.

Analogous Estimating


Analogous Estimating is one of the most common forms of estimating project activities. This technique uses the experience from previous projects and extrapolates that onto the current project. This technique is appropriate for those cases where the type of work is similar and the resources doing the work are the same between projects. Its advantage is that it is quick and, when the conditions are appropriate, it is usually fairly accurate. The disadvantage is that the organization must have similar projects for comparison.

Parametric Model Estimating


Parametric Model Estimating is a very accurate and easy estimating technique. A formula is developed for estimating the time or resources needed to perform a project activity. The formula is usually based upon a great deal of historical experience. A PMO will often develop the parametric model based upon having done lessons learned on many projects. A classic example from construction projects is the parametric model for estimating resources and time based upon the number of square feet of new construction. The advantage of parametric model estimating it is quick and accurate. The disadvantage is that models don't exist for activities until there is a large experience base for the activity.


3 Point Estimating


The 3 Point Estimating technique is used to understand the level of uncertainty embedded within an estimate. In this technique three estimates are generated for the project activity using three different sets of assumptions. The first estimate is a best case or optimistic estimate. The second estimate is a worst case or pessimistic estimate. The third estimate is between the other two and is the most likely estimate. The way those estimates are developed is by using one of the other techniques such as Analogous or Parametric Model. However, because of the high degree of uncertainty due to the risk assumptions, the three estimates are used to create a boundary on expectations for the activity. A variation on this technique, the PERT analysis, uses a weighted average of these estimates to create a PERT estimate. When using this approach, the most likely estimate is normally what is put in the project plan but the optimistic and pessimistic estimates are used during the reserve analysis. Also, an activity that has a great deal of difference between the optimistic and pessimistic estimates is an uncertain activity and should be tracked in the Risk Register. The advantage of this technique is that it provides boundaries on expectations. The disadvantages are that it takes more work - since three estimates must be created not one - and the most likely is still very much a guess - the actual could be significantly better or worse.


Expert Judgment Estimating


Expert Judgment estimating is easy to do - provided you have an expert on the project. This technique looks to the expert to create an estimate based upon their understanding of the project requirements. Many, if not most, project estimates are created in this fashion. The advantage of this is that it is quick and if the expert is knowledgeable, it is often the most accurate estimate for uncertain activities. The disadvantages are that you may not have an expert available and even if you do, the expert often can provide no solid rationale for their estimate beyond, "That's what I think it will take to do this."

Published Data Estimating


Published Data Estimating is an excellent technique for those activities for which there is published data. In this technique, the activity is compared to the activities for which data exists and the actual cost or durations of the closest comparable activity is selected from the data and used as the estimate. The advantage of this technique is that it is very accurate when the project conditions match the conditions under which the published data was generated. The disadvantages are that data does not exist for many activities and that the published data that does exist is based upon the characteristics of the organizations who compiled and published the data - which may not correspond with your organization's characteristics. (For instance you may have individuals on your project who are either much more or much less experienced than those who were in the projects comprising the data.)

Vendor Bid Analysis


The Vendor Bid Analysis is a technique used when working with suppliers on uncertain activities. The analysis considers the assumptions the vendor worked with and does a sensitivity assessment on those assumptions. In addition, for effort that the buying organization does not have experience with, they can contract with a consulting firm that has experience to do a "Should Cost" analysis. This "Should Cost" estimate is compared to the suppliers quote to identify any shortcomings. The advantages of this technique is that it exposes supplier risk that can be accounted for in the reserve analysis and it increases the confidence in the supplier's approach. The disadvantages are that this can take a fair amount of time and if a consultant is used to create a "Should Cost" it adds to the cost of the project.

Reserve Analysis


The Reserve Analysis is a fundamental technique for estimating. This technique considers the level of uncertainty and risk in the project and establishes a reserve pool of time, resources, or possibly performance that can be drawn upon to offset the unestimated issues that arise. With respect to schedule reserve, I will allocate the path float that I have on non-critical path tasks to provide a buffer around those tasks with the most uncertain estimates. For critical path tasks, I will either use a conservative estimate or include a "reserve" task that is used to resolve any problems that arise. (An example of a reserve task is "bug-fixing" on a software development project. I have been asked, "Why don't you just write software that doesn't have bugs. Then you won't need that task." Of course I don't intend to write software with bugs. However, experience has shown that the software is likely to have some, so I add a "bug-fixing" task as a reserve task to address the bugs. The specific bugs are not known when the task is created, but based upon the level of uncertainty in the software develooment, an amount of time and resources are set aside to resolve software development problems.) With respect to resource reserves, I will set the level of reserve based upon the uncertainty in the project and the risks. It is common to have resource reserves of 10% to 20% over the estimated cost of a project for those projects with high uncertainty. Although projects with low uncertainty might have 0% to 5% reserve. Again I allocate that reserve to the areas of highest uncertainty. I also will allocate a portion of the resource reserve to each phase in a phased project. This is to better match the actual the planned timing for the use of the reserve with when it is likely to be used. This avoids unnecessary variance reports. The use of performance reserves is when task deliverables are expanded to address unknown issues. For instance, we would typically design with a 50% design margin on our mechnanical device designs so that if there was a slight error in calculations or material properties, the design would still be robust enought to perform as needed. At the end of the day, the reserve analysis is a guess on the part of the project manager and stakeholders. If your organization has policies regarding reserves, use them. If not, use your best judgment.


Bottom Up Analysis


A Bottom Up analysis is a technique to improve the accuracy of the overall project estimate. This technique requires the project team to decompose the work into very small work packages. Generally, the smaller the project activity, the easier it is to estimate because the work scope is very small. All of these estimates of small activities are added up into subgroups and finally into the project total. The advantage of this technique is that the estimate is usually more accurate since the work is better understood. The disadvantages of this technique is that it is very time consuming, and it may be impossible to decompose activities that cannot be easily defined.

Project Simulation


A Project Simulation is a way of combining the uncertainty in 3 Point Estimates and Reserve Analysis to understand the likely project outcomes. This requires that the project be entered into a project management software application, being careful to identify all relationships between activities. For those activities that have uncertainty, the degree of uncertainty must be modeled and entered into the project management software also. The method for doing this will vary based upon the software being used. A simulation add-on is then used to run the software through a Monte Carlo routine. The result will be a distribution of project time lines and costs. Based upon the organization's risk sensitivity, the overall project time line and budget can be set. The advantage of this approach is that it provides a global perspective on overall time line and cost uncertainty. The disadvantages are that it can take months to do this on a large project and the resulting estimates are only as good as the assumptions that are allowed by the software. In my experience, the software is seldom able to truly model all of the uncertainty and relationships.


Estimating Based Upon Project End Date


In some cases, the project end date is set even before the scope and deliverables are defined. (I am reminded of Y2K projects.) In those cases, a high-level time line is created starting from the end date and going backward to the present time. Given the amount of time allocated for the major activities, the project team considers the needed deliverables and available resources during the time period. Essentially, the schedule side of the triangle is fixed and the scope and resource sides are varied so as to create a viable project. Often this will require an iterative estimating approach. Once the high level plan is established, estimates for the activities are developed and then iterations are done varying resources and scope until a viable estimate can be created. The Risk Register will be dominated by schedule risk items. Sometimes, an estimate cannot be created. In those cases, the project should not even be initiated, since it is doomed.


Estimating Based Upon Project Total Cost


In some cases, the project total cost is set even before the scope and schedule are defined. (I am reminded of construction projects funded by bank loans.) In those cases, a high-level allocation of the budget is created between the likely project deliverables. Each major activity is then estimated and if the estimate is greater than the allocated cost, the timing of resources or scope and deliverables are varied until the project is able to meet the budget goals. This is often an iterative process that may take many iterations until it completes.

Project Resource/Budget Planning Tools & Techniques

The project resource/budget plan is a description of how the business resources will be applied to the project activities. It includes the identification and deployment of the team's human resources and the planned financial impact of the project on the financial accounts and reports of the business. Resource/budget planning links with schedule planning and scope planning since the resources are required to perform the project activities (scope) at a particular time (schedule).

Many organizations have customized tools or templates to assist the project team with resource/budget planning that are linked to the organization's human resources or financial systems. I recommend that you use those if they are available. I have found six resource/budget planning tools or techniques to be helpful, depending upon the uncertainty and complexity of the project. These are the Team List, the Responsibility Matrix, and the Staffing Management Plan, all of which apply to assigning and managing human resources on the project. For budgeting, I recommend the Spend Plan, the Project Budget, and the Appropriations Request. There are two topics that are integrally related with budgeting but are also integrally related to other project management topics so they have received their own topic page. These are Project Estimating techniques and Earned Value Analysis.

Team List


The Team List is a very simple, yet vital, project management tool. This is a list of all the project team members and appropriate contact information. This is normally the only human resource planning tool required for Simple and Focused projects. In these cases, the Team List is used to ensure that a representative from each organization that is required to perform activities on the project has been identified and contacted. Because the scope and complexity of Simple and Focused projects is limited, there is usually only one individual from a participating organization assigned to the project and that individual's role is seldom of a full-time nature for the life of the project.


Responsibility Matrix


The Responsibility Matrix (also called the Responsibility/Accountability Matrix or the Roles and Responsibility Matrix) is a table that is used to provide clarity for all of the project team members concerning their expected level of involvement on the project. The matrix is normally constructed by listing the project tasks or activities down the vertical side of the matrix and the project team members on the horizontal side of the matrix. The project teram member who is responsible for planning and ensuring that each task is executed properly is identified in the matrix. In addition, the matrix will normally identify other project team members who are involved in some fashion on the activity.

The designation of the role of a project team member within the matrix can be done using several methods. The most common technique is to an acornym RACI. However, I have seen three different definitions of RACI in use. My preferred approach is to designate the responsible team member with an "R." If the activity is a cross-functional activity, I will indicate the other team members who must contribute to the work of the activity with a "C." If the activity requires an approval of one or more of the other project team members I will indicate that with an "A." Finally, I indicate those team members who need to be informed that the activity has been completed with an "I." If using RACI, be certain you know and understand the definitions that your organization uses.

The Responsibility Matrix is used primarily on Full-Scale projects as a tool for both communicating assignments and for risk identification with respect to the capacity and capability of project team members. If a team member is carrying a particularly heavy load, for instance if they are "Responsible" for many activities, there is a risk that the team member will be over-allocated and unable to perform some of the activities according to the project plan. Also, the matrix can put a spotlight on an individual who is being asked to accomplish activities beyond their experience or capacity. I find it is easier to have a discussion with the individual or their manager when we are looking at the requirements of the individual's column on the matrix rather than implying that the individual is somehow unable or incompetent to work on the project. Further, the matrix will indicate those activities where there is no "Contributing" support for the individual who is "Responsible." In those cases, there is a risk that if the team member on that activity is reassigned or temporarily unavailable, there is no one who can be immediately turned to on the project team to keep the activity moving along.

Staffing Management Plan


The Staffing Management Plan is a document or spreadsheet that indicates how the pool of available program human resources will be deployed across the sub-projects associated with a Complex program. A Complex program is normally managed by dividing the work into a set of inter-related Focused and Full-Scale projects. Key individuals and resource pools are likely to be supporting several of those sub-projects. The Staffing Management Plan indicates how that individual or pool should allocate their time, for instance 50% to Sub-project A, 30% to Sub-project B, and 20% to Sub-project C. Also, the Staffing Management Plan indicates how many individuals from the pool are allocated to each of the Sub-projects.

The Staffing Management Plan normally shows the allocation of the resources across the sub-projects over particular time periods. I usually create the Staffing Management Plan in a spreadsheet with each column representing a month. However, I have occasionally allocated resources by quarter and by week. The Staffing Management Plan must therefore be integrated with the high-level schedule of each sub-project so that resources are deployed at the appropriate time and so that the program manager will be aware when resources will be available for redeployment to other sub-projects.

Project Spend Plan


The Project Spend Plan is normally developed as a spreadsheet and lists the planned purchases of the project team. This plan is usually created for Simple and Focused projects as a means of communicating the spending intention of the project team. Because of the small size of these projects, the projects often are not tracked as separate line items in the organization's financial system. For these types of projects, the Spend Plan usually is short - and many times is non-existent (nothing is purchased on the project). When I create a Spend Plan, I usually divide the list into investments and expenses. For investments, I list the actual piece of equipment I intend to purchase. With expenses, I will further segregate them into several categories based upon the type of expense. The categories I normally use are: material, travel expenses, and contractors/temps.

Project Budget


The Project Budget is the time-based spreadsheet that shows the project team's intent to spend the organization's resources on project activities. The spreadsheet is typically organized by listing the project activities in the spreadsheet rows, and designating each column as a time period. I normally set up the Project Budget with each column representing a calendar month. However, I have occasionally further decomposed the activities to have each column represent a week. The data created in the Project Budget is transferred to the organization's financial planning and management system. Some organizations have dedicated project financial trackiong systems. These systems will have budgeting templates, forms and screens to assist the project team with the budgeting process.

All of the project activities are usually listed by some organizing principle based upon the policies and procedures of the organization. The most common organizing principles are: project phases, WBS structure, department/business function, geography/location, cost center, and cost category. Depending upon the magnitude and complexity of the project, several of the organizing principles may be used in combination with each other.

Once the Project Budget is created, the intended costs for each time period are summed in each column. Often the total for each column is shown, and a cumulative total is created showing the total intended costs from project start through each time period. Also, these totals are normally shown in graphs to assist in communicating the spending needs of the project.

Project Appropriations Request


The Project Appropriations Request is part of an organizational process rather than just a form or template. Many projects result in the creation of an investment asset that must be recorded on the organization's Balance Sheet. Once the investment asset is in service, it must then be depreciated - impacting both the Balance Sheet and the Earnings Statement. The values on these financial statements has a significant impact on taxes and on reporting to the investment community. It is imperative that the organization's financial management is aware of the investments created or procured by the project team. The project team communicates its investment intentions to the organization's financial management through the Appropriations Request process.

Each of the organizations I have worked with had their own unique process. Some had forms to complete, others had spreadsheets to be completed, still others had internal websites that guided an individual through the process. Regardless of your organization's specific approach, there are several elements that seem to be universal in the process. These are:
  • Identification of the asset by name or type of asset(milling machine, server, facility expansion)
  • Purchase price or development cost of the asset
  • Date the asset will go into service and be available for use

In addition, many organizations require the project team to provide additional information about the investment asset such as:
  • The financial benefit the organization will receive from having the asset in use (this is usually the business benefit of the project)
  • The return on investment calculation (NPV, IRR, payback period, or whatever other method is preferred by the organization
  • The depreciation schedule for the asset (this is often predetermined once the asset category is established)
  • The asset's residual value once it is fully depreciated 

Project Schedule Planning Tools & Techniques

The project schedule is the time-based and/or sequenced description of all of the project activities. The time element is one of the triple constraints that every project leader must contend with: scope, schedule, and resources/budget. There are a variety of techniques for both displaying the project schedule and analyzing the project schedule. Each technique focuses on a different aspect of the project. Depending upon the project objectives and major risks, different techniques should be used by the project leader. A brief description of each technique is listed below along with suggestions for when, and when not, to use them. The techniques for displaying the schedule are the Milestone Chart, the Task List, the Gantt Chart (Bar chart), the Network Diagram, the Two Dimensional Task List, and the Calendar View. The schedule analysis tools are the Critical Path analysis, the Critical Chain analysis, the PERT analysis, the Resource Leveling analysis, and a variety of Schedule Acceleration Techniques. For information on creating schedule estimates, please refer to Project Estimating.


Techniques for Displaying Project Schedules


Milestone Chart


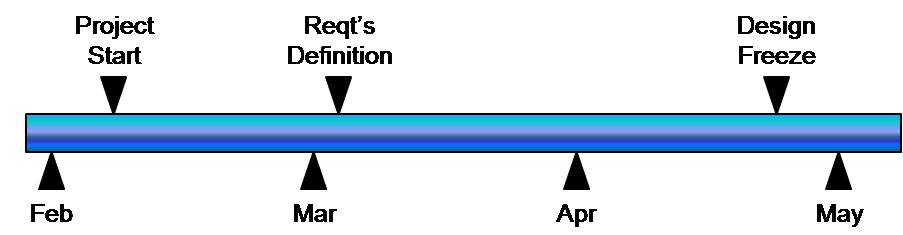
The milestone chart is portrayed on a project time line. It displays only the key project milestones. These milestones are typically associated with some major element of project risk, such as passing a test or gaining approval from a regulatory agency. Each milestone is represented by a diamond or triangle. These milestones normally become major reporting points to senior management. Large complex projects may have hundreds or even thousands of tasks. Senior management usually does not want to receive status reports at that level of detail, yet they want something more than just a tollgate review at the end of a phase. The milestones provide interim reporting points. Also, when planning a complex project, task leaders can become overwhelmed with all the tasks they must do. Having a focused sub-project for each milestone gives those task leaders a framework for planning and tracking project activities. The Milestone Chart is the schedule reporting format that I use on Full-Scale and Complex projects.

Task List


The Task List is the simplest of the schedule format tools, yet it can be the most powerful and useful tool with extended members of the project team. A Task List is just an action item list for the team member that contains all of the tasks that individual is responsible for completing. This provides a focus for the individual as to what they need to do. This format works very well with extended team members on large projects. In those cases, the project may contain hundreds of tasks but often the extended team member is only involved in a small number of those tasks. The extended team member can review their task list and understand what they must do on the project without going through the hundreds of tasks, searching for those requiring their effort. If the team has many extended team members with limited involvement in the total project, this technique usually is the best method for communicating and tracking scheduling of the work from those extended team members.


Gantt Chart (Bar Chart)


The Gantt, or Bar, chart is the most common schedule format used on projects. This format is excellent for tracking progress or activity for tasks once they have been scheduled. In the Gantt chart, every task is represented by a bar of a time line chart. The left edge of the bar is located at the time the task is planned to start and the right edge of the bar is located at the time the task is planned to end. As the project unfolds, the edges of the bars are often modified to reflect when the task actually started or ended. This format creates focus for tracking progress because it is clear to see whether a task should be completed, underway, or pending at any given time. The Gantt chart is used for daily/weekly tracking of project progress. It is easy to use and maintain. It has become the most commonly used project schedule chart because of its simplicity and the focus it creates when tracking the project. If the task estimates are relatively accurate, this is the preferred format. However, when task duration estimates are not accurate - either due to uncertainty in the amount of work or uncertainty in the resource availability - the Gantt Chart will be a frustrating and counterproductive scheduling tool. In those cases I recommend the use of the Network Diagram.


Network Diagram


The Network Diagram is essentially a flowchart of the project tasks. This format is a foundational technique for several analytical techniques. The network is created by determining predecessor and successor relationships and connecting the tasks based upon those relationships. This technique will create focus on the handoffs. In a complex project with many organizations/individuals involved, this technique can provide guidance as to who is the internal customer for each task. The technique is often viewed as a foundational technique since most of the advanced analytical scheduling tools start with the Network Diagram. When task durations are uncertain, the Network Diagram is often a better technique to use than the Gantt (bar) chart. The Network Diagram shifts the focus for uncertain tasks from arbitrary start and end dates to completion of the work and a handoff to the next task/activity.

Kanban Schedule


The Kanban Schedule is only needed occasionally. However, in those situations it both simplifies planning and tracking while improving the ability of the project manager to manage many of the project tasks effectively. This technique is used for scheduling and tracking a large quantity, or batch, of items through the same set of project tasks or activities. The Kanban schedule is a matrix with the vertical side being a list of the items in the batch and the horizontal being the set of tasks. The planned date for task completion of each item through the set of tasks is set in the corresponding box of the matrix. As a task is completed, normally the background color of the cell in the matrix is changed so that it shows completion. This change in color allows the project manager to quickly see when one item in the batch starts to fall behind or when many items in the batch become bottlenecked at one step in the set of tasks. When I use this approach, I will place a summary task on the project-level Gantt Chart or Network Diagram that represents the activity within the Kanban Schedule. Through the use of the matrix, hundreds of tasks can be tracked efficiently without burdening one of the other techniques with redundant activities..

Calendar View


The project calendar view provides a perspective on the current activities for the day or week. Each of the activities that should be underway on any given day are listed in that day on a calendar of the week/month/year. This view provides an excellent perspective of what tasks need to be staffed on each day. This leads to a focus on assigning resources. The primary purpose for this view is to aid in the daily staffing and resource assignments. It is most commonly used when the resources are assigned every day from a resource pool, such as test technicians or manufacturing operators.

Techniques for Analyzing Project Schedules


Critical Path


The Critical Path method is used to determine what the shortest time is to complete the project, or a phase of the project. The method analyzes every possible sequence of tasks based upon the network diagram to determine which sequence is the longest. This sequence is called the critical path because it sets the minimum time in which the project can be completed. A caution when using critical path it assumes that you have all the resources you need at all times. This is seldom a valid assumption, so the minimum time indicated by the critical path is seldom actually achieved on a project. To determine the critical path, the network diagram is created for the project with the maximum amount of parallel task as your risk sensitivity can tolerate. Each task duration is estimated, assuming the task will have the desired resources available when needed. With the durations and relationships from the network diagram, calculate first the earliest possible start date and finish date for each task. Then using the calculated project finish date, determine the latest possible start and finish date for each task that still supports that date. This set of calculations is normally done by project management software. The sequence of tasks with identical dates for early start and latest start are the critical path. The tasks have no float or slack a one day delay on one of these tasks immediately translates into a one day delay on the project.

Critical Chain


The Critical Chain technique was developed by Eliyahu Goldratt. This technique builds on the analysis done using critical path and resource leveling techniques. It is used when the resource leveling technique has delayed the end date of the project. Critical chain reprioritizes the work, applying principles of the Theory of Constraints, and provides simple tracking principles to accelerate the project and ease the burden on project management. This is done by determining the best allocation of the critical or constraining resource and shifting the tracking approach to concentrate on this resource. The critical chain approach requires the development of the network diagram and the critical path and resource leveling calculation to have been done. Once this is accomplished, the constraining resource or most constrained if there are multiple constraining resources is determined and a sequence of project tasks that the constraining resource MUST contribute to is determined. The estimates for those tasks are reviewed and any work that can be shifted to an unconstrained resource is reallocated. This sequence of tasks, known as the critical chain, is then scheduled based upon the availability of the constained resource. All other tasks are then scheduled to occur in parallel with the critical chain. These parallel paths are scheduled so as to ensure there is float, or a buffer, at the end of the path, prior to a handoff into the critical chain. This buffer float is then tracked by project management to ensure that these tasks and sequences complete prior to the need for their results by a critical chain task.


PERT


PERT, which stands for Program Evaluation and Review Technique, was developed by the US Navy in the 1960s as a way to put boundaries around overall project durations. At that time the Navy was doing development that was on the leading edge of technology and the estimates for task durations were often very uncertain. Individuals or organizations that were risk adverse would typically set a conservative schedule, while individuals or organizations that were risk seekers would often set an aggressive schedule. The final result would usually be between the two estimates. The Navy established the analysis tool of PERT to determine the best case and worst case boundaries for the project. In addition, they created a PERT estimate for each task and using the task-level PERT estimate they would create a project PERT schedule duration. The PERT estimate is a simple risk-mitigation approach that considers the best case and worst case of a task estimate but also includes a most likely estimate that is between the two and is heavily weighted. The three estimates are averaged using the PERT formula to create the PERT estimate for the task. A PERT analysis starts with a network diagram. Each task duration is estimated three times, the best case, worst case, and most likely case. A worst case schedule is developed using only worst case estimates. A best case schedule is developed using only best case estimates. A PERT estimate is determined for each task. A PERT project schedule is then set using the PERT estimates. This is often considered a poor man's simulation for estimating.

Resource Leveling


Resource Leveling is a technique used to smooth out the peaks and valleys in the required project resources. This leveling process usually results in changes to the project schedule. Through the use of leveling, the best allocation of resources assigned to the project can be determined. The resource leveling technique applies when the project has been planned with a high degree of parallelism. Usually in this case many of the different parallel paths will have float (unless they are a critical path). That float is used to reposition tasks so that the resources required to conduct that task are not needed at the same time on another task. To do resource leveling, first the network diagram is developed and the task durations and resources requirements for each task are determined. Next the critical path is calculated. Resources are then assigned to critical path tasks first. Once all critical path tasks have been fully resourced, then the resources are assigned to the other tasks using float to reposition tasks between their earliest start and latest finish time and at a time when resources are unallocated. If, after using float to reposition tasks, there is still an insufficient amount of resources at some time in the project, then tasks are stretched or delayed past their latest finish time until the resources are available. This will extend the end date of the project. This analysis is typically done using project management software. However, a caution when using software some applications do not fully protect the critical path but are quick to start stretching and delaying tasks.

Schedule Acceleration


Schedule acceleration techniques are used to shorten the overall length of the project. However, they are not free. While they reduce the planned total duration of the project, they do so by increasing risk in some other aspect of the project. They need to be deployed carefully, and always with an update to the project risk management plan. There are five schedule acceleration techniques - each with its own unique set of risks. Selecting the technique, or combination of techniques, to be used depends on the characteristics of the activities to be accelerated and the overall risk sensitivity in the project.

Buffer Management - Buffer management reduces the buffer that is inherent in the estimates of uncertain activities. When estimating uncertain activities, project managers tend to allow for the uncertainty by using a conservative estimate. (This is not the same as "padding" an estimate which just arbitrarily adds time or money to an estimate - rather this is a conscious decision to prepare for the unknowns associated with the uncertain activity.) Buffer management removes the buffer from the activity estimate, thereby creating an aggressive activity estimate. The setting of aggressive activity goals will often result in a reduced activity duration. However, the risk is that now there is a much higher probability that the activity will finish late as compared to the plan. When this technique is used, the project manager needs to maintain a project-level schedule reserve to compensate for the activities that will be late.

Crashing - Crashing accelerates an activity by adding additional resources. Some activity durations are limited by resource availability - more resources would allow a faster completion. While this is not true for all activities, it is true for some. (A 72-hour burn-in test on a printed circuit card module cannot be accelerated by adding additional test technicians - it still takes 72 hours. However a dedicated courier can deliver a report overnight that would normally take three days to deliver by mail.) This will often increase the overall cost of the project as the additional resources are often added at a premium.

Fast-tracking - Fast-tracking accelerates the project by starting activities prior to the completion of all the predecessor activities. This can only be done when there is a preliminary result of the predecessor activities. For instance, a preliminary Bill of Materials may be developed during a design process and raw materials for production may be ordered based upon the preliminary Bill. (This is often done when ordering Long Lead Material.) If the Bill of Material does not change during the final design review and baselining process, the project is accelerated. However, if the final Bill of Material does change, the material ordered from the preliminary Bill may need to be reworked or scrapped - increasing the effort and cost to the project. This technique is viable when the predecessor activity has a preliminary deliverable that the project management team believes is stable.

Split-to-Phases - The Split-to-Phases technique is used when the project has multiple, separable objectives. The scope of the project is divided into phases based upon the activities that are unique to a project objective. This allows a focusing of project resources on the activities supporting one of the objectives at the expense of the activities supporting a different objective. This will result in an early completion of a portion of the project, but usually causes a delay in another portion of the project and often an increase in cost because of activities that must be repeated for each of the phases. (For instance there may be a User Acceptance Test that would now need to be done twice instead of just once.) This acceleration technique is appropriate only when the completion of the first phase is able to immediately start producing some business benefit, without the completion of the succeeding phases.

Mainline-Offline Scheduling - the Mainline-Offline technique separates the work within an activity into two components. The first is that which can be done generically without specific knowledge of the results of predecessor activities. The second is that which can only be done once the predecessor activities are complete. An example would be creating a project requirements document. A generic template can be created based upon the general understanding of the project. The specific requirements are identified based upon meetings with stakeholders or analysis of business processes. (One of the business benefits of a Project Management Office is that it develops and maintains these templates and generic activities, allowing projects to be accelerated through the use of them.) This technique only works with some activities, and requires the foresight to anticipate the need for the generic portion of the activity to be accomplished prior to the completion of the predecessor activities. Once an activity has started, there is no advantage to do the activity first in a generic manner and then in the project specific method.

These methods can be used in a stand-alone manner or in combinations. However, they all result in some level of increased risk to the project. Whenever a schedule acceleration technique is used, the risk analysis must be updated to include the risk associated with the technique failing to deliver the potential benefit.

Project Scope Planning Tools & Techniques

The project scope is a description of all the work that must be done on a project. It includes all of the deliverables and all of the activities needed to create the deliverables. Scope planning links with schedule planning and resource/budget planning since each task or activity must be scheduled to occur at a particular time in the project and each task or activity requires an individual or organization be assigned to do the work.

I have found that often a project leader or project team will confuse the concept of project scope with that of product scope. Product scope is the complete list of features, functions, or characteristics that a product or service is intended to provide. The activities needed to complete the product scope are elements of the project scope. However, the project scope will include many additional activities that are unique to managing the project but are not deliverables within the product. For example, the project scope includes preparation and support for meetings, reviews, supplier management, and preparation of documentation. When a project leader or project team member only considers product scope while planning the project, they will under plan the amount of time and resources needed to complete the project.

Many organizations have customized tools or templates to assist the project team with scope planning. I recommend that you use those if they are available. I have found five scope planning tools or techniques to be helpful, depending upon the uncertainty and complexity of the project. These are the Traceability Matrix, the Scope Statement, a Deliverables Deployment, the Work Breakdown Structure (WBS), and the WBS Dictionary.


Traceability Matrix


The Traceability Matrix is most commonly used on Complex projects. The matrix is a table that traces each requirement through any related sub-project's requirements and through the project life cycle to ensure that it is fully satisfied. It is both a planning tool, showing the project management team's intention with respect to meeting the requirement, and a tracking tool, as it also shows the results of any test or analysis that demonstrates the requirement has been partially or fully met.

The types of requirements included in a traceability matrix typically include:
Business goals or objectives
Product requirements
Business process requirements
Logistical support requirements
Regulatory or agency requirements
Project safety or security requirements
When these requirements are flowed down to sub-projects, the allocation methodology is documented and, if necessary, interfaces control documents are used to control the interaction between sub-projects.

Project Scope Statement


The Project Scope Statement is a document that is used to provide clarity for both the project team and project stakeholders. The scope statement describes the major deliverables, provides a high-level description of acceptance criteria, and many times will also include constraints and project exclusions. On a Simple or Focused project, the Scope Statement can usually be captures within a paragraph or two. On a Full-scale or Complex project, the Scope Statement may be several pages in length.

When a large project has many divers stakeholders and project work is being accomplished in several locations, the Scope Statement becomes a continuing reminder of what the project is supposed to do, and what it is not supposed to do. It is referred to at Tollgate reviews to ensure the project stays on course and does not suffer scope creep.

Deliverables Deployment Diagram


The Deliverables Deployment Diagram is a socpe planning technique for Extreme or Adaptive projects. This technique starts with a deliverable of the project and then asks the question, "What is needed to create that deliverable?" This question may need to be asked several times to break the project deliverables down into actionable activities. This technique is especially powerful when the project deliverable has been changed and a revised scope must be established. I normally will create this diagram in fishbone or mind-map layout. Once all of the activities are identified, I then transfer them into a WBS Dictionary.

Work Breakdown Structure


The Work Breakdown Structure (WBS) is a deliverables oriented, hierarchical decomposition of project requirements. Major deliverables are subdivided into smaller more manageable activities. These activities then become the building blocks used to plan the project. A WBS is typically developed in layers. At the highest layer are the major project deliverables. As project planning progresses, each of these are decomposed into sub-activities. In a phased project, the decomposition of some deliverables may not occur until earlier phases are completed. Each activity can be further decomposed to lower and lower layers until the activity is at a level that can be planned and managed by the project team. If a project is not decomposed sufficiently, the project leader and project team may not be aware of significant risk items until the risk is out of control. If a project is decomposed excessively the decomposition creates many unnecessary tasks that generates an enormous bureaucratic burden on project management without providing improved oversight of the project.

There are several different ways to decompose the major project deliverables. They can be decomposed based upon subdividing deliverables as described in the Deliverables Deployment Diagram. They can also be decomposed based upon business process. They can be decomposed based upon which organization or department will do the work. It can also be decomposed based upon which project phase in which different elements of the work will be done. Any of these methods is acceptable and often a WBS is developed in a mix and match mode where different levels are developed using different approaches. My recommendation is to organize the decomposition based upon the way you intend to control the project. When organized in that manner, you can roll up lower levels of performance to quickly provide a high-level assessment of project status. However, on Complex projects, often there is a WBS structure that is mandated for the sub-projects. This aids the program manager in his or her effort to consolidate the sub-project inputs into an overal program plan and status. This approach is a benefit for the program manager but is often a bureacratic nightmare for the sub-project leader.

A WBS can be presented in two different modes. One mode is a diagram that looks like an organizational chart. The top of the chart is the major deliverables. As each layer is decomposed, additional levels are shown on the chart. The second mode is a table. The left column(s) shows the level of decomposition. Typically a numbering system or code is used to identify each item in the table. Each digit in the identifier number represents a different layer of decomposition. The table mode often is soon transformed into a WBS Dictionary which is discussed in the next section.


WBS Dictionary


The WBS Dictionary incorporates the table mode of showing a WBS with additional information about each of the activities. Typically a WBS Dictionary is built using a spreadsheet. The WBS information is in the first few columns of the spreadsheet. Additional columns are added that are the repository of both planning and controlling information about each activity. I prefer to use the columns:
Task Deliverable
Responsible Individual/Organization
Duration
Budget
Risk Factors
Status

When managing a project using a spreadsheet as the project management information system the WBS Dictionary is the primary planning tool and tracking tool. Many Simple and Focused projects are managed using the spreadsheet approach. When that approach is chosen, the WBS Dictionary documents the result of the planning processes. As the project unfolds and additional activities are identified or if the project needs to be rebaselined at a Tollgate meeting, the spreadsheet is updated.

Project Management Initiating Tools & Techniques

Project Initiation is the process or activities associated with defining the boundaries of a project, or project phase, and gaining the approval of appropriate stakeholders to begin the work of project planning and project execution. Project initiation is always company-specific. While many of the tools of project planning or project control are standard and universal, the initiating tools must interact with the company's business environment and strategy planning process, and therefore are far less formal or deterministic. The project objectives, which form the basis for project boundaries, are directly related to the business strategic imperatives. These are different from business to business and they change over time. The stakeholder analysis involved in approving a project are based upon a combination of the business organizational structure and the personalities of the individuals involved.

The Project Management Institute identifies several outputs from the Initiating processes. These are the Project Charter, a Project Stakeholder Register, and a Stakeholder Management Strategy. On small or simple projects I recommend that these all be rolled into one document. On larger more complex projects, I suggest that two deliverables are created during project initiation, a Project Charter and a Stakeholder Register that incorporates the stakeholder strategy decisions. I use a variety of tools and techniques to create these documents, depending upon project complexity and uncertainty. These include: W's, In-Frame/Out-of-Frame, Project Dimensions, Project Requirements Document, Communication Strategy Matrix, and Collaboration Strategy Matrix. The project leader needs to determine which of these tools and techniques are appropriate for their project. Typically only two or three of them are used. The project leader should always follow corporate policies and directives with regards to required tools or techniques. In addition, unique characteristics of the project may require different tools.

Project Charter 


The Project Charter documents the basic attributes of the project, essentially the project boundaries. As such it captures the understanding of the project by the project sponsors and senior management at the time they approve the project to go forward into a planning phase. The charter is not an in-depth project plan. It is a high-level document. It describes the expectations of the customers of the project and the senior management for the project results. A charter is normally developed by the portion of the business that is sponsoring the project, not the project team. On small projects the charter may only be a one-page document. On larger projects, the charter may require many pages.

A project team uses the charter document to assist in the planning process. The team attempts to develop a project plan that has a strong potential of achieving the project objective while staying within the project schedule and budget boundaries found in the charter. An example of a Project Charter format that I have used on small projects with several clients is shown.

Stakeholder Register 


The Stakeholder Register documents the stakeholder planning process. It is often started during the initiating process. However, this is a living document. While created during the initiating process, it is continuously updated throughout the life of the project. During the project new stakeholders are often identified and the role or interest of stakeholders may change due to changes in business priorities or reorganizations. The Stakeholder Register tracks these changes and guides the project leader in making decisions with respect to stakeholder interaction planning.

A project leader uses the Stakeholder Register to guide elements of the Project Communication Plan. In addition, project risks, reviews and decision meetings are often structured based upon the strategies documented in the Stakeholder Register. Further, the project attributes associated with the stakeholder's "Wins" will inevitably become linked to entries on the Risk Register.

W's


The "W's" are one of the simplest methods for identifying the boundary conditions for a project. This technique is often used with small projects. It consists of discussing with the sponsor the answers to several questions that have a "W" in them. These questions can be asked in any order.
"What?" What is the project intended to do or deliver?
"Who?" Who is the primary customer and are there any other key stakeholders?
"When?" When does the project need to end? When does it need to start?
"Where?" Where will the project activity be conducted?
"Why?" Why is this project needed? Is it related to a specific business strategy or goal?
"How?" How should this project be accomplished? Are there any constraints on the approach, any procedures or regulatory guidance that must be followed, or any financial or resource constraints? (The "w" was on the end of "How")


In-Frame/Out-of-Frame 


The "In-Frame/Out-of-Frame" analysis is an excellent technique for clarifying project boundary conditions with stakeholders who are vague or often change their mind. An effective use of this technique at the beginning of a project will significantly decrease the incidents of scope creep. This technique identifies all of the major elements that are to be accomplished and puts them "In the Frame." It also lists activities, analysis and work that, though potentially related to the project, is not requested or required by the stakeholders. These items are listed as "Out of the Frame." An important clarification is that the "Out of Frame" items are not itmes being withheld from the stakeholders, rather there is an agreement with the stakeholders not to expend project time and project money on those items.

The "In-Frame/Out-of-Frame" analysis assists the project team in setting a clear definition of scope. Often there are several possible interpretations of a project requirement. This analysis clarifies the interpretation. This analysis minimizes the likelihood of scope creep because it forces the stakeholder to clarify the boundary of acceptable performance. Many instances of scope creep are due to stakeholders asking for "just one more thing." This analysis defines the limits of what can be done with the available time and money in the project. If at the time of project initiation the "In the Frame" list is more extensive than the desired end date or budget can reasonably be expected to deliver, the discussion with the stakeholder occurs at that time to either limit the project scope or increase time and/or money.


Project Dimensions 


Karl Wiegers introduced the concept of categorizing the various project requirements into different "dimensions." These dimensions are related to the criticality of the requirements. This tool is useful on larger, more complex projects and programs. When discussing with stakeholders the nature of their requirements, determine how strategically important each requirement is. Some requirements are "Constraints." There is no flexibility with respect to these requirements. If this requirements cannot be met, the project is canceled. Very few requirements are truly in this category. For these requirements, the project plan should be constructed to minimize risk in those areas. The next category of requirements is "Drivers." These requirements are often expressed by stakeholders in terms such as, "As much as ..." or "As soon as ...." These requirements should be optimized to achieve the best overall mix among them. If you have many stakeholders, this may prove to be difficult as some stakeholders will probably need to compromise on there preferred solution or actions in order to accommodate some others. The final category is "Degrees of Freedom." These are items that are not requirements in the minds of any stakeholders, yet are elements of the project that must be accomplished in order to complete the project. Since there are no stakeholder imperatives with respect to these requirements, these are the areas where the project team should be the most creative and take the most risk. When completing a Project Dimensiopns I normally use a spreadsheet to capture the items. There are often more than one hundred items between all of the categories.

Project Requirements Document


A Requirements Document is a formal document that describes all of the requirements for a project. It is most commonly used in government contracting or large commercial construction projects and programs. This document is prepared by the buying organization in order for sellers to fully understand all requirements of a project when they prepare to bid on the project or portions of the project. When a government agency determines that it will source a major project effort, the agency develops the requirements document. The document contains all of the technical and managerial requirements appropriate for the government agency and the type of project work. The document can easily be hundreds of pages in length.

Communication Strategy Matrix 


The Communication Strategy Matrix is a tool for determining the communication strategy to be used with each stakeholder. On a small project with one or two stakeholders, the matrix guides the project leader to determine the specific communication techniques to be used with those stakeholders. On larger projects with many stakeholders, the communication strategy for each stakeholder is a major input used when developing the project communication plan.

Each stakeholder is considered individually. The stakeholder is placed in one of the four quadrants of the matrix. Based upon the quadrant, the communication strategy for that stakeholder is set. One caution with this technique, a stakeholder's oversight or interest may change as the project moves from one phase to another or as business conditions change. Therefore, the stakeholder's position within the matrix should be periodically reviewed and updated.

Collaboration Strategy Matrix 


The Collaboration Strategy Matrix is a tool for determining the type of collaboration that must be done with each stakeholder. Collaboration in this context implies that the stakeholder must be involved in the activities and decisions of a portion of the project. On a small project with only one or two stakeholders, the matrix guides the project leader in determining the level of involvement required from the stakeholder. On larger projects with many stakeholders, the collaboration strategy drives decisions on project planning and on project review meetings.

Each stakeholder is considered individually. The stakeholder is placed in one of the four quadrants of the matrix. Based upon the quadrant, the collaboration strategy for that stakeholder is determined. The selected strategy indicates the level of involvement by that stakeholder in decision-making, both during planning and execution phases of the project. The more stakeholders involved, the more project management effort required to manage the relationships and interactions with stakeholders.

Project Complexity and Project Management Methodology

The Complexity Spectrum considers the project characteristics that drive project integration difficulties. The higher the degree of integration complexity within a project, the higher the level of project risk. Projects with a high degree of integration complexity are likely to require more robust risk management techniques than those with little integration complexity. Some of the project management tools and techniques work well with simple projects but are unable to efficiently handle high degrees of complexity. Some project management tools and techniques manage complexity very well but are cumbersome and difficult to use on simple projects.

There are many possible ways for assessing integration complexity. In our experience, two factors that are relatively easy to estimate prior to the development of a project plan and provide excellent correlation with complexity are a high level estimate of the project effort and a high-level estimate of the project duration. Neither of these factors needs to be determined with any degree of precision when assessing them for the Project Complexity Spectrum. A general understanding of the amount of effort, based upon an approximate number of tasks or deliverables is adequate. Also, a general estimate of the project duration will suffice.

The Project Complexity Spectrum differentiates projects into four categories, Simple, Focused, Full-scale, and Complex. Simple projects are short projects with limited scope and activities. Typically they require about fifteen to twenty tasks or activities in order to complete them. The duration may be from several days to several months. Focused projects are those with a major category of deliverables or business milestone requiring a significant amount of work, however, there is usually only one major category of deliverables or one business function involved. We sometimes refer to these as "100 day projects" since they often take three to four months to complete. Full-Scale projects typically require many major deliverables. The integration issues on these projects are significant. The hundreds of activities and deliverables require a high degree of technical integration. These projects usually are six to twenty months in duration. Complex projects include "programs" as defined by the Project Management Institute. They are large, multi-year, multi-deliverable, multi-stakeholder, multi-team member location projects often with multi-million dollar budgets. Given all of these "multi's" it is no wonder that integration is at the forefront of the project management activities on Complex projects.

Simple Projects


As sated before, Simple projects are short projects with limited scope and activities. Typically they require about fifteen to twenty tasks or activities in order to complete them. These projects are usually completed by one person or occasionally a small team. Normally there is only one deliverable and one major stakeholder that needs to be kept informed of project progress.

The characteristics of the simple project do not require the use of project management tools that are focused on integration complexity. The major project integration risk on Simple projects is that the individual doing the work becomes distracted by the other aspects of their job, creating errors and delays. The project management tools that often fit best with the Simple project are personal productivity tools. Prioritized tasks lists and network diagrams are excellent tools for planning the project. There is little or no need for internal project integration meetings since the work is usually being done by just one person. The only project reviews needed are periodic pulsing meetings with management or the stakeholder to report progress. These meetings are usually short and conducted informally.

An example of a Simple project would be an individual who is using plans in a "handyman book" to build a deck on the back of his house. He first plans out the steps that must be accomplished, obtains the materials and then builds the deck. The project is likely to be accomplished over several weekends. The Stakeholder reviews are conducted over coffee with their spouse.

Focused Projects


As stated before, Focused projects are those with a major category of deliverables or business milestone requiring a significant amount of work, however, there is usually only one major category of deliverables or one business function involved. Usually there is a small team of individuals who are assigned to this project. There may be multiple stakeholders for this project, but they typically are in agreement on the project charter. The project leader role is not a "full-time" position so the project leader is either one of the team members with technical responsiblities (for example - the database engineer) or a full-time project manager will be managing several focused projects. The major integration risk on this project is the technical integration of the tasks required to complete the project deliverable(s). Focused projects are often sub-project's within larger more complex projects or programs.

Focused projects require all of the basic elements of project management and they benefit from the use of a standard methodology associated with the type of project (eg. software development, facility construction, Six Sigma). When the organization does not have a standard project management methodology, a "hero" can still often manage this project to success. These projects should have a charter or initiation document, though it is often only one or two pages. The project leader role is part-time and the project leader is usually a technical contributor on some activities within the project. The project leader defines, organizes and staffs the activities with support from stakeholders and management. The project control activities will include appropriate technical reviews (usually only one or two) and regular reviews with stakeholders.

An example of a Focused project is the individual who hires a contractor to build a sunroom addition onto the back of his house. In this case there is a formal bid and proposal process and selection of the contractor. The contractor, who may also be the lead carpenter on the job, commits to a cost and schedule. There are several workers and other subcontractors on the project, including concrete for the foundation, electricians and carpet layers. Also there is a building code permit and inspection. The project takes several months to complete all of the exterior and interior work. There is a project plan and the home owner reviews it with the contractors on a periodic basis. The major risk issues are the technical integration of the activities, such as did the electrician finish roughing in the wiring before the dry wall was put up.

Full-Scale Projects


As stated earlier, Full-Scale projects typically require many major deliverables and hundreds of tasks and activities. These projects usually involve many departments within the organization. The projects should be managed by a full-time project leader who is supported by a cross-functional core team which is often located at multiple locations. In addition to the complex technical integration, the cross-functional nature of the work and the multiple locations creates significant team and organizational integration issues. Also these projects usually have multiple stakeholders with varying objectives, all of which must be integrated into the project plan. Since these projects usually are six to twenty months in duration,they will often be reviewed in at least two annual budgeting cycles. As budgets change and business priorities change, the project will almost always experience at least one point of significant re-direction.

Full-Scale projects require effective use of the full complement of project management tools and techniques. The complexity within these projects are such that the project leader is seldom able to "muddle his way through" the project. A standard project management methodology is very beneficial on these projects. The methodology clarifies for the project leader and the core team members what is required and who has responsibility for the various project deliverables. These projects are often managed in a phase or "toll-gate" approach so as to provide appropriate management oversight over the project progress. In my experience, all of the project management processes described in the PMBOK will likely be used on these projects

The focus of the full-time project leader is typically on communication and risk management. They are balancing the triple constraint of scope, schedule and resources (budget). The core team members are managing the technical activity definition and completion for their portion of the project. The project leader is tracking the issues that inevitably arise and to ensure the issues don't turn into major risks. The project leader is also spending much of his or her time communicating with stakeholders, both to understand whether their requirements are evolving and to inform them of the status of risks and mitigation actions with respect to quality, schedule and budgets.

Continuing with our home construction theme, an example of a Full-Scale project would be the design and construction of a custom home. The home owner would hire a general contractor and an architect. The contractor and architect would develop plans, including budgets and schedules, and identify building sites. Once the owner approves the plan, the contractor and architect begin the permitting process and identify subcontractors. The general contractor is balancing the work of all of the subcontractors, the overall cost and schedule, along with interacting with all of the regulatory agencies. As the construction begins, there are appropriate reviews by the owners and the zoning committee or permitting agencies. Inevitably, the home owner will want some changes as they see the construction progress. Eventually the home is built, the interior is decorated, the landscaping is installed and the homeowner moves in.

Complex Programs


Complex projects require a full-time program manager and they are best managed by subdividing the work into a portfolio of "Focused" and "Full-Scale" projects. Systems engineering and configuration management become crucial components of the project management tools that are used by the program manager. The overall program goals and objectives must be allocated to the subprojects and invariably tradeoffs must be made between subprojects in order to achieve the program goals.

The program manager for Complex programs is less likely to be personally using all of the PMBOK practices. He or she is relying on the subproject leaders of the Focused and Full-Scale projects to project manage those subprojects appropriately. The program manager maintains a high level program Work Breakdown Structure that shows the allocation of effort among the subprojects. Also, the program manager maintains a high-level, milestone schedule and the overall program budget. All of these are reviewed and kept current at regularly scheduled program reviews where each subproject presents their status and their major risk issues. The program manager balances the risk between the subprojects and watches for high-level risk trends.

Integration is the focus of everything the program manager is doing. The program manager will have a master schedule that incorporates the major elements of each of the subprojects detailed schedules. The program manager will have the overall program budget, allocated to the subprojects, with a reserve to address unexpected problems within a subproject or areas that are overlooked by each of the subprojects. Also, the program manager will have a program requirements document, usually many pages thick. In addition, the program manager will have created a set of subproject requirement documents. These map the program requirements to the subprojects and the interfaces between each of these are managed closely by the program manager.

Applying the concept of a Complex program to the home construction example that has been used with the other project types leads us to the construction of a large subdivision. The program manager is integrating with all of the construction managers on each house and working with zoning committees. The program manager must ensure that roads and utilities are being installed. They also need to integrate all of these activities so that multiple things are happening at the same time without interfering with each other. For instance, when the road crew is paving, the individuals working on home construction still need to be able to get to their job site. Integration is the key to success so that each house construction project can maintain their schedule and the infrastructure of the subdivision can be installed on time and on budget.